The airticle shows how to display list in python and mathematica with a few examples.
The examples come from An Elementary Introduction To The Wolfram Language
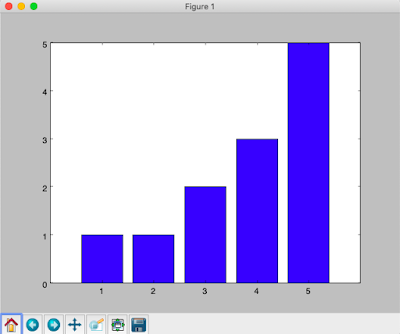
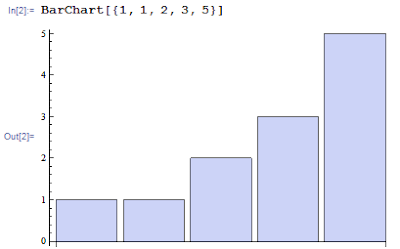
Make a bar chart of { 1, 1, 2, 3, 5 }
Python:
import matplotlib.pyplot as plt

y = (1,1,2,3,5)
x = range( len(y)+1 )
x = x[1:] #slice to store [1,2,3,4,5]

plt.bar( x, y, align='center' )
plt.xticks( x )
plt.show()
Wolfram:
BarChart[{1,1,2,3,5}]
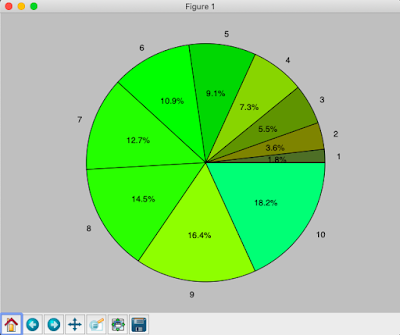
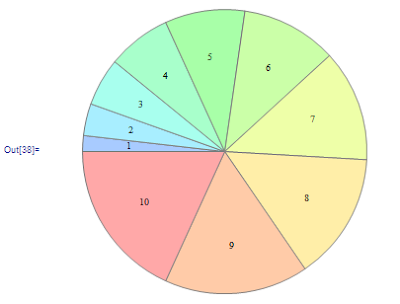
Make a pie chart of numbers from 1 to 10
Python:
import matplotlib.pyplot as plt

values = range(1,11)
labels = ['1','2','3','4','5','6','7','8','9','10']

# colors refrence link: https://en.wikipedia.org/wiki/Web_colors
colors = ["DarkOliveGreen", "Olive", "OliveDrab", "YellowGreen", "LimeGreen", "Lime", "LawnGreen", "Chartreuse", "GreenYellow", "SpringGreen", "MediumSpringGreen", "LightGreen", "PaleGreen", "DarkSeaGreen", "MediumAquamarine", "MediumSeaGreen"]

plt.pie( values, labels=labels, autopct='%1.1f%%', colors = colors )
plt.axis( 'equal' )
plt.show()
Wolfram:
Values=Range[10]

Labels={"1","2","3","4","5","6","7","8","9","10"}

PieChart[Values, ChartLabels→ Labels]
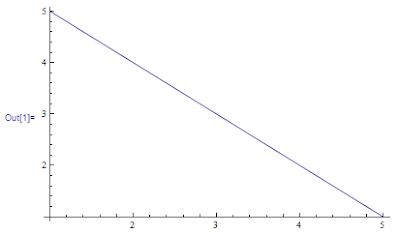
Display numbers from 5 to 1 in a line
Python:
import matplotlib.pyplot as plt

data1 = list( range( 1, 6 ) )
x = data1
data1.reverse()

plt.grid( True )
plt.plot( x, data1 )
#plt.xticks( x ) # adjust unit length of X axis
plt.show()
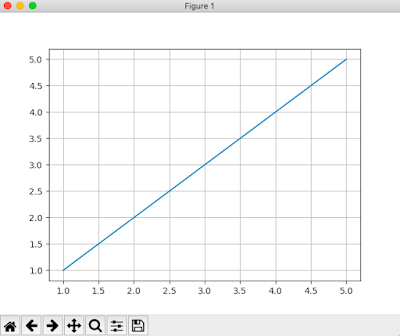
Wolfram:
ListLinePlot[{5,4,3,2,1}]
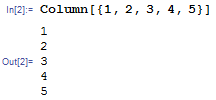
Display numbers from 1 to 5 in a column
Python:
import numpy as np

print( np.array(range(1,6)).reshape(5,1) )
output:
[[1]
 [2]
 [3]
 [4]
 [5]]
Wolfram:
Column[{1,2,3,4,5}]
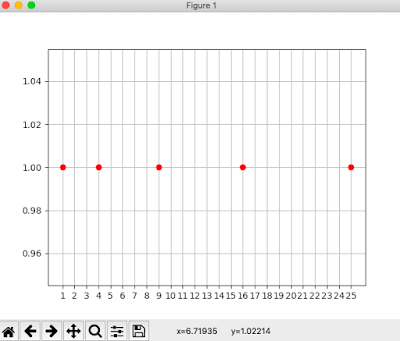
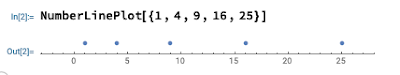
Make a number line plot of the squares {1, 4, 9, 16, 25}
Python:
import matplotlib.pyplot as plt

x = [1]
for it in range( 2, 6 ):
    x.append( it*it )
y = [1,1,1,1,1]

print( x )
plt.xticks( range(1,26) )
plt.grid( True )
plt.plot( x, y, "ro" )
plt.show()
Wolfram:
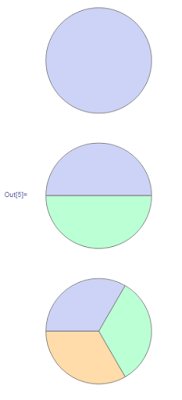
Make a column pf pie chart with 1, 2 and 3 identical segments
Wolfram:
Column[{PieChart[{1}],PieChart[{1,1}],PieChart[{1,1,1}]}]
