The article introduces how to expand the sampling area from a cell. I marked the area red color, the center point is computed as the mass center of the original cell.
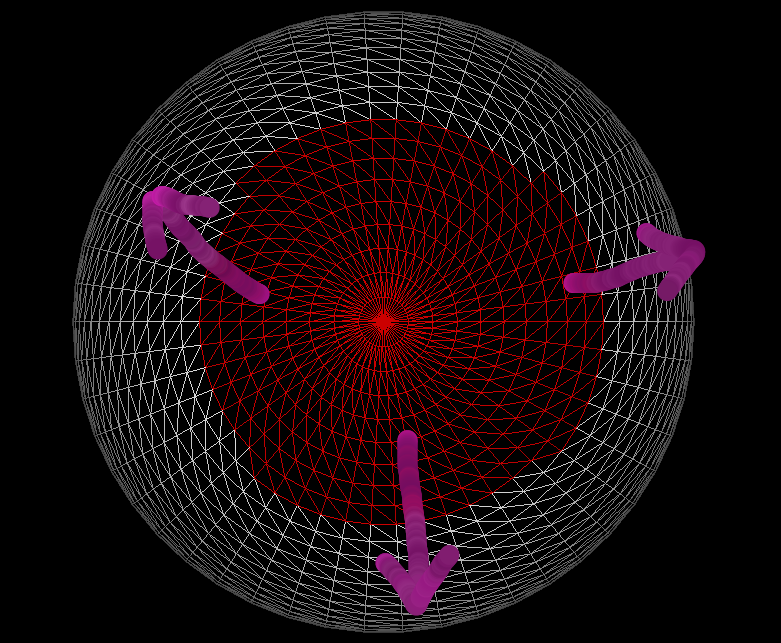
Step 1, find all cells which are near to the center point within a distance.
We can use the interface vtkPolyData::GetCellEdgeNeighbors to collect neighbor cells and analyze them. If all points of the cell are near to the original center point within a special distance, the cell is regarded as a neighbor area.
Prepare data.
int main (int, char *[])
{
    vtkNew<vtkSphereSource> sphereSource;
    sphereSource->SetThetaResolution( 50 );
    sphereSource->SetPhiResolution( 50 );
    sphereSource->Update();

    auto *pd = sphereSource->GetOutput();
    pd->BuildCells();
    pd->BuildLinks();
The implementation details about find neighbor cells.
    // ================= start to sample ===================
    struct Edge
    {
        vtkIdType cellId;
        vtkIdType edgePt1;
        vtkIdType edgePt2;
    };
    vtkIdType centerCellId = 0;
    vtkIdType nPts;
    vtkIdType *pts;
    pd->GetCellPoints( centerCellId, nPts, pts );

    PointStruct centerPos( 0, 0, 0 );
    for( int i = 0; i < nPts; ++i )
    {
        PointStruct ptPos( pd->GetPoint( pts[i] ) );
        centerPos = centerPos + ptPos;
    }
    centerPos /= nPts;
    const double disLimit = 0.3;

    vtkNew<vtkIdList> sampleCellIds;
    sampleCellIds->InsertNextId( centerCellId );

    std::vector<Edge> currrentEdges;
    for( int i = 0; i < 3; ++i )
    {
        Edge edge;
        edge.cellId = centerCellId;
        edge.edgePt1 = pts[i];
        edge.edgePt2 = pts[ (i+1) % 3 ];
        currrentEdges.push_back( edge );
    }
    vtkNew<vtkIdList> visitedCellIds;
    visitedCellIds->InsertNextId( centerCellId );

    std::vector<Edge> nextEdges;
    while ( currrentEdges.size() > 0 )
    {
        for( int i = 0; i < currrentEdges.size(); ++i )
        {
            Edge edge = currrentEdges[i];
            vtkNew<vtkIdList> neighborCellIds;
            pd->GetCellEdgeNeighbors( edge.cellId, edge.edgePt1, edge.edgePt2, neighborCellIds );

            for( int j = 0; j < neighborCellIds->GetNumberOfIds(); ++j )
            {
                auto neiCellId = neighborCellIds->GetId( j );
                if( -1 != visitedCellIds->IsId( neiCellId ) )
                {
                    continue;
                }
                pd->GetCellPoints( neiCellId, nPts, pts );
                vtkIdType thirdPt = -1;
                for( int k = 0; k < 3; ++k )
                {
                    if( pts[k] != edge.edgePt1 && pts[k] != edge.edgePt2 )
                    {
                        thirdPt = pts[k];
                        break;
                    }
                }
                PointStruct thirdPos( pd->GetPoint( thirdPt ) );
                if( (centerPos - thirdPos).Length() > disLimit )
                {
                    continue;
                }

                Edge edge1;
                edge1.cellId = neiCellId;
                edge1.edgePt1 = edge.edgePt1;
                edge1.edgePt2 = thirdPt;

                Edge edge2;
                edge2.cellId = neiCellId;
                edge2.edgePt1 = edge.edgePt2;
                edge2.edgePt2 = thirdPt;

                nextEdges.push_back( edge1 );
                nextEdges.push_back( edge2 );
                visitedCellIds->InsertNextId( neiCellId );
            }
        }

        currrentEdges.swap( nextEdges );
        nextEdges.clear();
    }
    // ================= finish: sample ===================
Step 2, mark the collected cells red color.
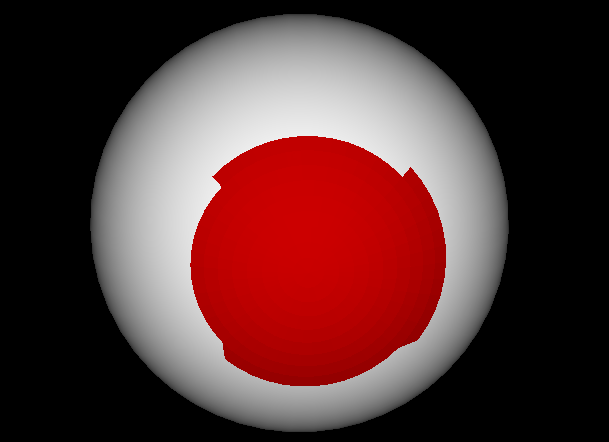
Then we can set scalars for cell data and create vtkColorTransferFunction object to define the different colors for the two kinds of cells.
The code snippet.
    // ================= use cell scalar to draw it ===================
    vtkNew<vtkCharArray> cellTypes;
    cellTypes->SetNumberOfComponents( 1 );
    for( int i = 0; i < pd->GetNumberOfCells(); ++i )
    {
        cellTypes->InsertNextValue( 0 );
    }
    for( int i = 0; i < visitedCellIds->GetNumberOfIds(); ++i )
    {
        auto cellId = visitedCellIds->GetId( i );
        cellTypes->InsertValue( cellId, 1 );
    }

    pd->GetCellData()->SetScalars( cellTypes );
    pd->GetCellData()->Modified();

    vtkNew<vtkPolyDataMapper> sphereMapper;
    sphereMapper->SetInputData( pd );
    sphereMapper->SetScalarModeToUseCellData();
    sphereMapper->SetColorModeToMapScalars();

    vtkNew<vtkColorTransferFunction> lut;
    lut->AddRGBPoint( 0, 1, 1, 1 );
    lut->AddRGBPoint( 1, 0.8, 0, 0 );
    sphereMapper->SetLookupTable( lut );
    // ================= finish: draw =====================
Another way is to create a new polydata by vtkPointLocator object and show it by an independent actor.
    // ================= use point locator to draw it ===================
    double bounds[6];
    pd->ComputeBounds();
    pd->GetBounds( bounds );

    vtkNew<vtkPoints> samplePoints;
    vtkNew<vtkCellArray> sampleCells;
    vtkNew<vtkPolyData> samplePolyData;

    vtkNew<vtkPointLocator> locator;
    locator->InitPointInsertion( samplePoints, bounds );
    cout << "points size: " << samplePoints->GetNumberOfPoints() << endl;

    for( int i = 0; i < visitedCellIds->GetNumberOfIds(); ++i )
    {
        int cellId = visitedCellIds->GetId( i );
        vtkNew<vtkIdList> ptIds;
        pd->GetCellPoints( cellId, ptIds );
        vtkIdType newCell[3];

        for( int j = 0; j < ptIds->GetNumberOfIds(); ++j )
        {
            double ptPos[3];
            pd->GetPoint( ptIds->GetId( j ), ptPos );
            locator->InsertUniquePoint( ptPos, newCell[j] );
        }

        sampleCells->InsertNextCell( 3, newCell );
    }
    cout << "points size: " << samplePoints->GetNumberOfPoints() << endl;
    cout << "sampleCells size: " << sampleCells->GetNumberOfCells() << endl;

    samplePolyData->SetPoints( samplePoints );
    samplePolyData->SetPolys( sampleCells );
    samplePolyData->BuildCells();
    samplePolyData->BuildLinks();
    // ================= finish: draw =====================

    vtkNew<vtkPolyDataMapper> sampleMapper;
    sampleMapper->SetInputData( samplePolyData );

    vtkNew<vtkActor> sampleActor;
    sampleActor->SetMapper( sampleMapper );
    sampleActor->GetProperty()->SetColor( 0.8, 0, 0 );

    vtkNew<vtkRenderer> render;
    render->AddActor( sampleActor );
[…] 相关文章: VTK – Sort The Points On The Circle VTK – Expand Sample Area From A Cell […]