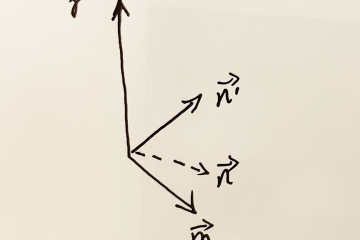
VTK – Set Scalar Range And Show Different Colors
We will compute the distance to the sphere for every point. Write the distance value to point data as scalars. Set different colors for the different distance ranges.
Sort all numbers by their counts and display the numbers one by one. These count sets look like different buckets.
Rotate about z-axis by the angle theta. Verification: So we can get the following conclusions about rotations about x-axis, y-axis and z-axis independently.
The angle between two vectors can be calculated by the dot product. We want to find the direction of the rotation. Here are two different ways to get it done. 1、Compute the value of Sine of the angle, then we Read more…
Here is a way to remesh 3D model, for every edge we can add a few points on it and create new small cells. The old big triangle will be removed from the model.
Here is a way to increase density for the 3D model, for every triangle cell we can add a center point and create 3 new small cells. The old big triangle will be removed from the model. You can read other relative posts about changing cells.
Generate a new polyData which has not invalid point. We have to colloct the points that are used by cells and update the point ids in the cell lists. I used binary search algorithm to speed up the process.
We have to find all edges and judge whether the point is in the circumscribed sphere of another three points, the target edge is used by two cells, it has only one neighbor cell in the other words. Finally, flip the cells as the above image.
But the result of the cutting is not particularly idealistic.
So we have to increase density necessarily.
The left one is the low density model, the right attachment model has higher density in the following image.