Draw a circle and an inner circle
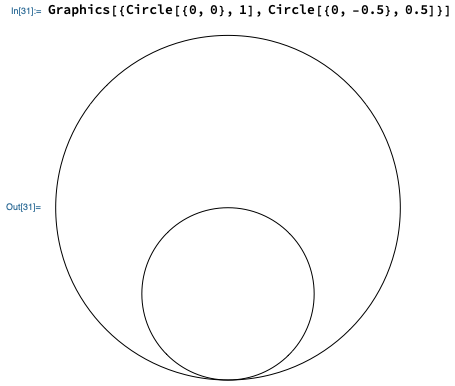
Graphics[{Circle[{0, 0}, 1], Circle[{0, -0.5}, 0.5]}]
Draw 10 circles which has center (i,i) and i is in {1,10}
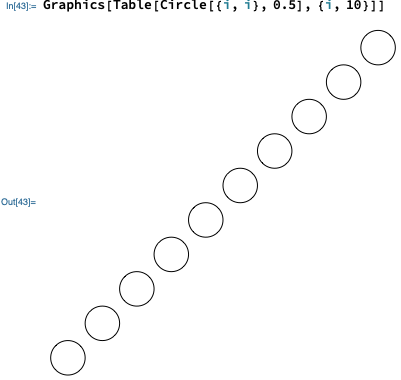
Graphics[Table[Circle[{i, i}, 0.5], {i, 10}]]
Connect 10 points which is at (i,i)
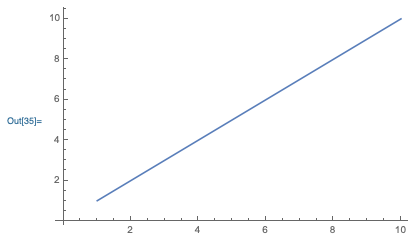
data = Table[{i, i}, {i, 10}] ListLinePlot[data] Or: Graphics[Line[data]]
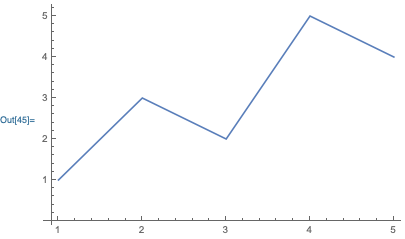
ListLinePlot[{{1, 1}, {2, 3}, {3, 2}, {4, 5}, {5, 4}}]
Draw all random points as circles
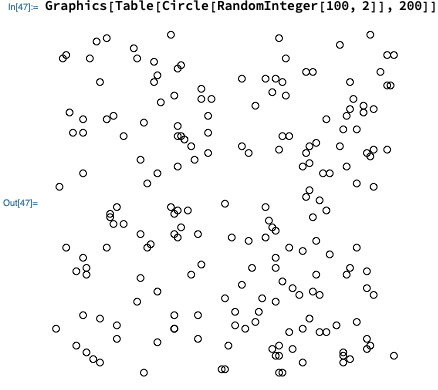
Graphics[Table[Circle[RandomInteger[100, 2]], 200]]
Draw two 3D spheres
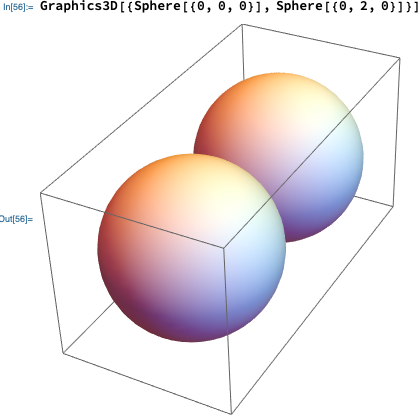
Graphics3D[{Sphere[{0, 0, 0}], Sphere[{0, 2, 0}]}]
Make 10 concentric circles with random colors
circles = Table[Style[Circle[{0, 0}, r], RandomColor[]], {r, 1, 10}] Graphics[circles] 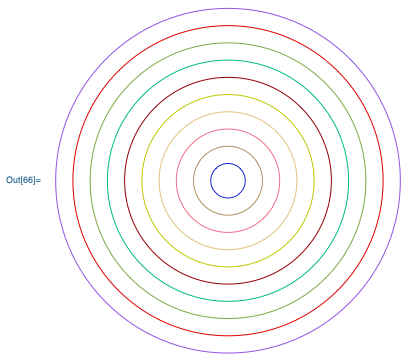
Create 5 × 5 number grid
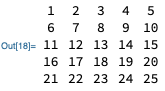
Grid[Table[(i - 1)*5 + j, {i, 5}, {j, 5}]]
Visualize values in an array. Larger values are shown darker.
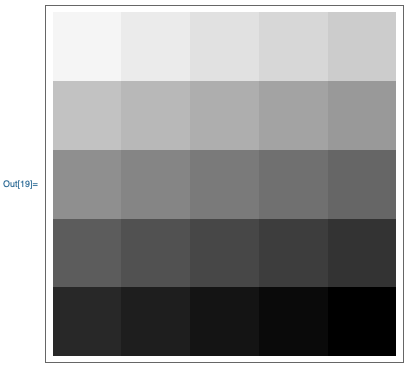
ArrayPlot[Table[(i - 1)*5 + j, {i, 5}, {j, 5}]]
Make a line in 3D that goes through 50 random points with integer coordinates randomly chosen up to 50
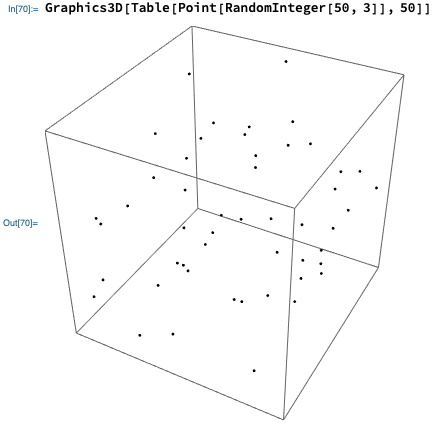
Graphics3D[Table[Point[RandomInteger[50, 3]], 50]]
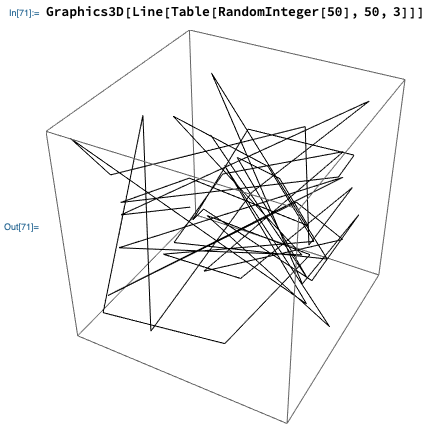
Graphics3D[Line[Table[RandomInteger[50], 50, 3]]]